Looking at Air Pollution
Credit: NPS
The purpose of Air Quality Awareness Week is to bring attention to air pollutants that damage human health and environmental health.
Background
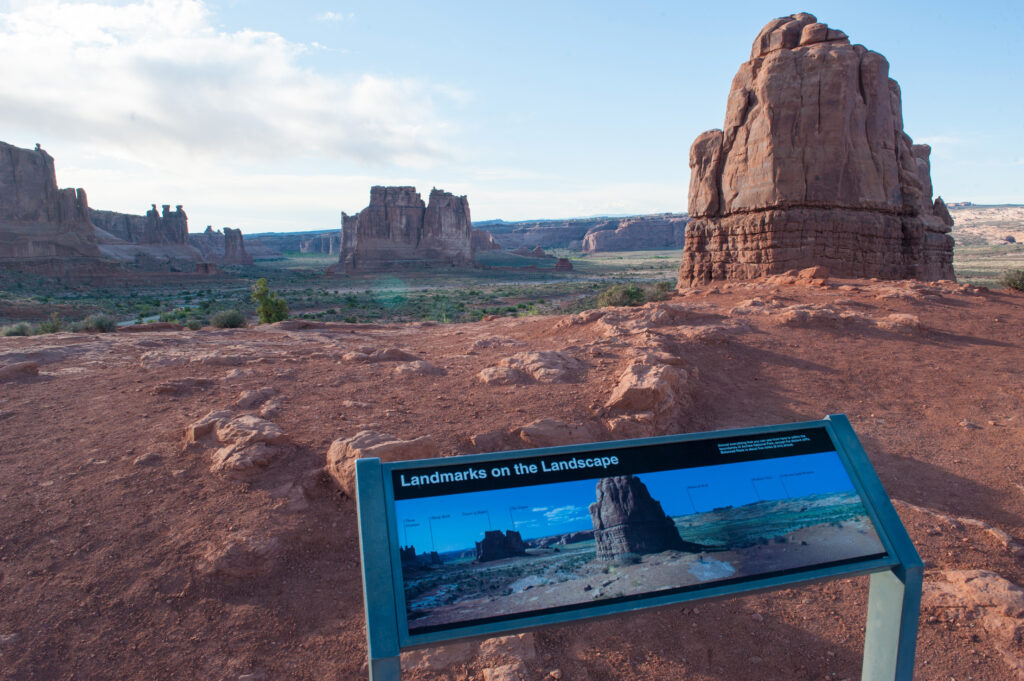
Many people first think about air pollution when they look out a window at a familiar view or stop to admire a famous landmark and see less than they expected. Air pollution can create haze that affects how well people can see views of natural and historic vistas. Particles in the air affect perception by softening textures, fading colors, and obscuring distant features. Humans contribute to haze with air pollution from industry, power generation, transportation, and agriculture. Natural haze from dust, wildfires, or sea salt can also affect how well people can see (visibility). How much haze obscures views depends on the size, number, and chemical composition of the particles in the air.
The Clean Air Act gives special air quality and visibility protection to national parks larger than 6,000 acres and wilderness areas larger than 5,000 acres that were in existence in 1977, when the act was amended to include this protection. These areas are called “Class I” areas. The Fish and Wildlife Service manages 21 Class I areas, National Park Service manages 48 Class I areas, and the Forest Service manages 88 Class I areas. One goal of the Clean Air Act is to ensure that new sources of air pollution do not reduce visibility in these Class I areas.
How do we measure haze? The IMPROVE (Interagency Monitoring of Protected Visual Environments) network monitors the concentration and composition of particles in the air. Some national parks also take photos every 15 minutes using air quality webcams in fixed locations so that you can see how the park looks under current weather or air pollution conditions.
Visibility resources to share:
EPA has a map summary of how visibility has improved in Class I Areas over the past 20 years: https://gispub.epa.gov/air/trendsreport/2021/#scenic_areas
The NPS website includes text and video about how the IMPROVE stations measure air quality.
With improvements in air quality in the East, you can now see the Washington Monument from Shenandoah National Park on clear days, but further air quality improvements are possible.
This illustration shows different types of haze, including plumes, layered haze, and uniform haze. To share this image or find out more, visit the NPS Visibility page.

Suggested social media post:
You can use modeling tools on the WinHaze webpage to see how different haze conditions change the views at many national parks and national forests and several wildlife refuges.
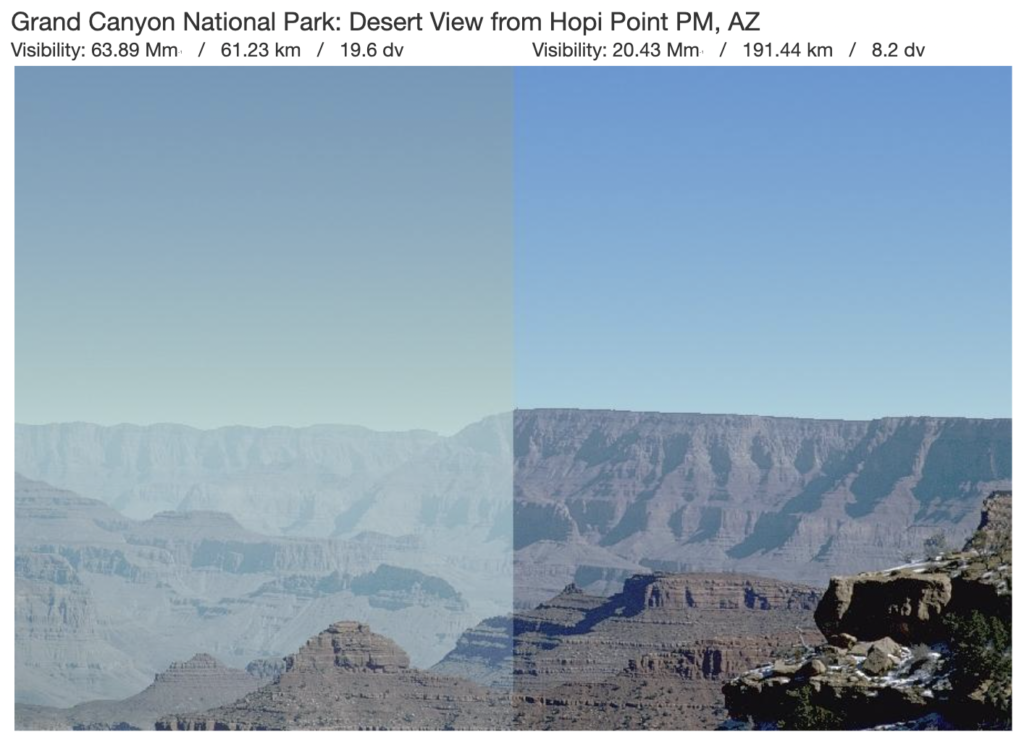
This image is an illustration of the haziest days in 2009 (left) and the haziest days in 2019 (right) at Hopi Point in Grand Canyon National Park. It shows how improvements in air quality at the Grand Canyon have sharpened the colors and details that visitors are able to see on even the most polluted days during each year. The data on haziest days from the Grand Canyon Conditions and Trends page was entered into WinHaze to generate this image.