Educational Resources
Acid Rain
“Acid rain” became a household term in the 1980s when unchecked emissions from industry and motor vehicles were blamed for causing environmental deterioration. Scientific evidence has linked acid rain to decreased fish and wildlife populations, degraded lakes and streams, and human health hazards. Although the term has since faded from public consciousness, acid rain is a complex and global problem that still exists today.
What is Acid Rain?
First identified in 1872 in Sweden and studied in the U.S. beginning in the 1950s, acid rain is precipitation in the form of rain, snow, hail, dew, or fog that transports sulfur and nitrogen compounds from the high atmosphere to the ground. Sulfur dioxide (SO2) and nitrogen oxides (NO, NO2) are bi-products from burning fuels in electric utilities and from other industrial and natural sources. These chemicals react with water, oxygen, carbon dioxide, and sunlight in the atmosphere to form sulfuric and nitric acids. The acids reach the ground and change the chemistry within the environment.
The acidity of any solution is determined on the pH scale of 0 to 14. A pH level of 0 to 7 is considered acidic; 7 is neural; and a level above 7 is alkaline. As the pH number decreases, acidity increases. Unopened bottled distilled water has a pH of 7, so it is neutral. In comparison, household ammonia is an alkaline with a pH of 11.5. Milk is slightly acidic with a 6.5 pH, and soft drinks, which contain phosphoric acid, have a 3.1 pH.
Although the pH scale may seem straightforward, determining the pH of “normal” rain is much more complex. When distilled water is exposed to air, an interaction with carbon dioxide increases acidity through the formation of carbonic acid, H2CO3, and the pH level falls. Many scientists agree that the normal pH of rain is a slightly acidic 5.6 because of perpetual chemical interactions in the air.
What’s more, rain pH levels can vary significantly over short distances and in a short amount of time, even during the same rainfall. Seasons, climate, and a host of other factors can also influence the acidity of rain.
Rain and snow are not the only processes that deposit sulfur and nitrogen acids from the atmosphere to the ground. These compounds are also present in gases and dry particles, which are more difficult to measure. Like wet deposition, the occurrence of “dry deposition” of acids varies in different areas, depending on distance from the emission source and climatic conditions.
What Causes Acid Rain?
Acid rain is linked to both natural and man-made sources. Nitrogen oxides are formed through the extreme heating of air when a thunderstorm produces lightning. Also, sulfurous gases are discharged from erupted volcanoes and rotting vegetation.
However, most public attention has been focused on man-made sources of acid rain, which include the burning of any fuel that contains sulfur and nitrogen compounds, including public utilities, industrial broilers, motor vehicles, and chemical plants. Electric power generation accounted for 69 percent of total sulfur dioxide emissions in the U.S. in 2007 and 20 percent of nitrogen oxides, according to the U.S. Environmental Protection Agency (USEPA).
Many industrial sources of sulfur dioxide are located in the eastern U.S., particularly in the Midwest and the Ohio Valley where coal combustion and power generation frequently occur. Typically, the highest nitrogen oxide emissions are found in states with large urban areas, a heavy population density, and significant automobile traffic.
Acid rain is not limited to the region where sources are located. Prevailing winds can blow chemicals in the atmosphere for hundreds or even thousands of miles before being deposited, regardless of state and country boundaries. For instance, compounds from industry in China can potentially be deposited in the U.S. Midwest. For this reason, acid rain is considered a global problem.
What are its Effects?
Acid rain has been linked to detrimental effects in the environment and in human health.
Forests, lakes, and streams: Acid rain can cause widespread damage to trees. This is especially true of trees at high elevations in various regions of the U.S. Acidic deposition can damage leaves and also deplete nutrients in forest soils and in trees so that trees become more vulnerable to disease and environmental stress.
When lakes and streams become more acidic than normal, they cannot continue to support the same types of fish and aquatic life as in the past. Fish communities dwindle due to high mortality, a reduced growth rate, skeletal deformities, and failed reproduction. Lakes ultimately become home only to species that can tolerate high-acid conditions. Game fish, such as trout, are particularly sensitive to acidic water conditions.
A healthy lake has a pH of 6.5 or higher. Only a few fish species can survive at a pH of below 5; at a pH of 4, the lake is considered dead. A decrease in fish populations is often the first sign of an acidification problem.
Not all lakes are equally vulnerable to acid rain, however. In some areas, such as in Illinois, the average pH of a freshwater lake is an alkaline 8 to 9 because soils and rocks in the bottom and sides of the lake contain high levels of calcium and magnesium, which neutralize the acidity of rain. Lakes surrounded by granite, such as in New England and northern New York, don’t fare as well.
Plants and crops: Acid rain can potentially reduce agricultural production by changing the chemical properties of soil, slowing the rate of microbiological processes, and reducing soil nutrients. Roots of natural vegetation and crops can become damaged due to stunted growth. Human effects: Acidic water moving through pipes causes lead and copper to leach into the water. Most public water suppliers remove such dangerous chemicals at the plant, but tainted water could be a problem for residents who don’t rely on public water supplies for their drinking water.
Acidic fog can be more hazardous to health than acid rain as small droplets can be inhaled. These atmospheric acids can cause respiratory problems in humans such as throat, nose, and eye irritation, headache, and asthma. Acid fog is particularly dangerous for the elderly, those who are ill, and people who have chronic respiratory conditions.
Man-Made Materials: Although sunlight, heat, cold, and wind contribute to the deterioration of man-made structures and objects, acid deposition speeds up this process. Metal structures and vehicles become corroded, and limestone buildings, tombstones, statues, and monuments deteriorate faster when rain is acidic.
How is Acid Precipitation Collected?
Wet deposition samples can be measured to determine chemical concentrations in almost any area. The National Atmospheric Deposition Program (NADP) at the Wisconsin State Laboratory of Hygiene, University of Wisconsin-Madison, maintains five networks with more than 350 deposition monitoring sites. The NADP National Trends Network has 250 sites in the U.S. located far from the point sources of pollution. Each site has an automated precipitation collector and gauge to gather samples only during rain or snowfall.
Weekly samples are collected and sent to the NADP for analysis. The network measures acidity and calcium, magnesium, sodium, potassium, sulfate, nitrate, chloride, and ammonium ions. Data are available online at http://nadp.slh.wisc.edu/. These monitoring efforts support research and policy on air quality issues.
NADP monitoring data show that wet sulfate deposition has decreased an average of 30 percent since the early 1990s in the eastern United States. The largest decreases occurred in Maryland, New York, Virginia, West Virginia, and Pennsylvania. Nitrogen deposition has decreased as well, but to a lesser extent.
Legislative mandates, federal government programs, and environmental-friendly changes in fossil fuel use in electrical power plants have successfully lowered the emission of SO2 and NOx and the resulting acid deposition in the U.S. since the 1980s. However, the problem still exists. Scientists continue to try to fully understand acid rain and its long-term effects on the environment and on human health.
Bibliography
American Chemical Society. 1982. Acid Rain. American Chemical Society. Washington, D.C.
H. John Heinz III Center for Science, Economics and the Environment. 2008. The state of the nation’s ecosystems: 2008. The Heinz Center, Washington, D.C.
Likens, G. (Lead Author); Environmental Protection Agency (Content source); W. Davis, L. Zaikowski, and S. C. Nodvin (Topic Editors). 2007. Acid rain. In: Encyclopedia of Earth. Eds. Cutler J. Cleveland (Washington, D.C.: Environmental Information Coalition, National Council for Science and the Environment).
Stanitski, C. L., L. P. Eubanks, C. H. Middlecamp, and W.J. Stratton. 2000. Neutralizing the threat of acid rain. in Chemistry in Context (third ed.). American Chemical Society. U.S. Environmental Protection Agency. 2009, January. Acid rain and related programs: 2007 Progress Report. USEPA. Washington, D.C.
Air Quality Awareness Week
Air Quality Awareness Week
The purpose of Air Quality Awareness Week is to bring attention to air pollutants that damage human health and environmental health.
Mercury in Fish
New Research Underscores Health Warnings on Mercury in Fish
U.S. mercury levels in precipitation have decreased slightly in the past few years. Still, new research findings of high mercury levels of fish in lakes, streams, and reservoirs show that mercury continues to pose a health concern for pregnant women and children who eat fish in their daily diets.
The Fish-Methyl Mercury Connection
Rain and snow flush mercury out of the atmosphere and into waterways. There, natural processes convert mercury to the highly toxic methyl mercury, starting a food-chain reaction. Small organisms absorb methyl mercury from water and lake sediment. Small fish consume the organisms, and in turn, are consumed by larger fish. With each step up the food chain, methyl mercury further accumulates, so that the largest predator fish often have high levels of methyl mercury. These concentrations in large fish can be more than a million-fold higher than in the surrounding water, according to the U.S. Environmental Protection Agency (USEPA). Fish with the most concentrated levels of methyl mercury include predator fish from oceans and lakes: sharks, swordfish, king mackerel, largemouth bass, walleye, and northern pike.
New research has shown the problem is widespread. From 1998 to 2005, researchers at the United States Geological Survey tested methyl mercury contamination in 34 varieties of predator fish (1,000 fish total) in nearly 300 rivers and streams across the United States. Mercury concentrations at 27 percent of sites exceeded the USEPA guidelines for safe fish consumption (0.3 parts per million).
A USEPA study in late 2009 found that mercury concentrations exceeded recommended levels at 48 percent of lakes and reservoirs nationwide; mercury concentrations in fish were found in nearly all 50 states.
Health Effects
For most people, fish consumption does not cause a health concern. However, special populations are at risk for detrimental health effects, including damage to the heart, kidneys, and the central nervous system. Most at risk are pregnant women, women who might become pregnant, nursing mothers, and children.
Exposure to methyl mercury has been shown to impact the developing nervous system of unborn and young children, resulting in various disabilities. Based on studies of women with high mercury levels, the USEPA estimated that more than 300,000 newborns each year in the U.S. may have an increased risk of learning disabilities associated with methyl mercury exposure.
Mercury can accumulate in people, as well as in fish. When methyl mercury is consumed, it takes about 70 days for half of the mercury ingested to be removed from the body, according to the Illinois Department of Public Health.
In efforts to address this problem, every state in the U.S. except for Wyoming and Alaska has issued advisories warning at-risk groups to limit fish consumption, especially avoiding the large fish varieties. Special mercury advisories are issued for lakes, streams, or reservoirs when higher concentrations of methyl mercury are found in fish compared with fish from similar water sources.
A Global Issue
Mercury is emitted into the atmosphere and surface waters from natural sources, including volcanoes and wildfires. It also occurs naturally in some soils. Yet most of the attention on mercury in the environment has focused on the man-made sources: coal combustion, medical waste incineration, and chlorine production, among others.
Only 17 percent of mercury deposited in the U.S. originates there, according to the USEPA. As much as 83 percent comes from international sources. USEPA research indicates that U.S. mercury sources influence concentrations in the environment much more in the eastern U.S., and global sources are more significant contributors in the West.
The Mercury Deposition Network (MDN) at NADP, which traces mercury in wet deposition (through rain and snow), has indicated that the highest deposition of mercury from the atmosphere occurs along the Gulf of Mexico and in Florida.
Across the nation, acidic waters draining from forests and wetlands typically produce fish with high levels of mercury concentrations due to their particular water chemistry, and land cover characteristics promote the transport and accumulation of mercury.
A Healthy Balance
Nutritionists have long known that fish is a part of a healthy diet. Fish contain lean protein, some essential nutrients, and omega-3 fatty acids, which are linked to heart health. In recent years, federal agencies have weighed the health costs of consuming neurotoxins against the nutritional benefits of fish. The U.S. Food and Drug Administration (FDA) has provided at-risk populations three recommendations for eating fish. By following these recommendations, women and young children will receive the benefits of eating fish while reducing their exposure to the harmful effects of mercury.
- Do not eat shark, swordfish, king mackerel, or tilefish because they contain high levels of mercury.
- Eat up to 12 ounces (2 average meals) a week of a variety of fish and shellfish that are lower in mercury (shrimp, canned light tuna, salmon, pollock, and catfish).
- Check local advisories about the safety of fish caught by family and friends in local lakes, rivers, and coastal areas. If no advice is available, eat up to 6 ounces (one average meal) per week of fish from local waters, but don’t consume any other fish during that week.
The Mercury Deposition Network (MDN) compiles data on mercury concentrations in precipitation from 80 sites across the U.S. and Canada. Data are available on the MDN Web site: http://nadp.slh.wisc.edu/networks/.
Concentration vs Deposition
The concentration and deposition of compounds are linked, but are not the same. The National Atmospheric Deposition Program (NADP) at the Wisconsin State Laboratory of Hygiene uses both measurements to determine where and how much acids and other pollutants are deposited, at what rate, and by which route.
Concentration is a measure of how much of a given substance (e.g., nitric acid) is mixed with another substance (e.g., water). The greater the amount of chemicals in the substance, the greater the concentration. For example, for health reasons it is important to determine how much of a quantity of nitrates is in a lake, or how much arsenic is in groundwater.

Concentration is expressed as a quantity or mass per unit volume of water collected. At the NADP laboratory, scientists measure the concentration of various compounds found in samples of rainwater, typically how many milligrams of a substance are in a liter of water (mg/L).
Deposition is a measure of the amount of a chemical that is transferred to a certain amount of ground, typically by rainfall, snow, hail, or sleet. The NADP network of sites samples precipitation weekly, so deposition is measured by the amount or mass of chemical transferred to a square meter of ground in one week (kilograms/m²).

The concentration of certain substances is measured in the lab, and this result, multiplied by the amount of rainfall, provides an estimate of the deposition of that substance within a specific area. Scientists use this information to detect short- and long-term trends in acid and mercury deposition.
Sample Analysis
What Happens to Precipitation Samples Once They Leave the Field?
Every Tuesday morning at 9:00 a.m., operators at approximately 250 sites across North America carefully collect precipitation from rain collectors and data from gauges and ship samples to the National Atmospheric Deposition Program at the Wisconsin State Laboratory of Hygiene for testing. These weekly samples enable scientists to track the types of pollutants that are distributed from the atmosphere to the earth in rain and snow (wet deposition).
Careful handling of precipitation samples from the field to the final review in the laboratory is critical to obtain precise data. Mishandled or compromised samples can easily become contaminated. Our laboratory, the NADP Analytical Laboratory (NAL) uses standard operating procedures with checks and balances to ensure data accuracy.
The following four steps track precipitation samples through the NAL.
1. Shipping and Receiving
The NAL provides sample bags, sample bottles, and shipping containers, typically 1-liter bottles (shown below), to the network sites. Shipping and Receiving logs in approximately 250 samples each week into a database, assigning each sample a unique ID. At this point, a sample is uniquely identified, tracked through the lab, and is associated with a digital version of a sites sample information (date on and off, operator field notes, etc.)
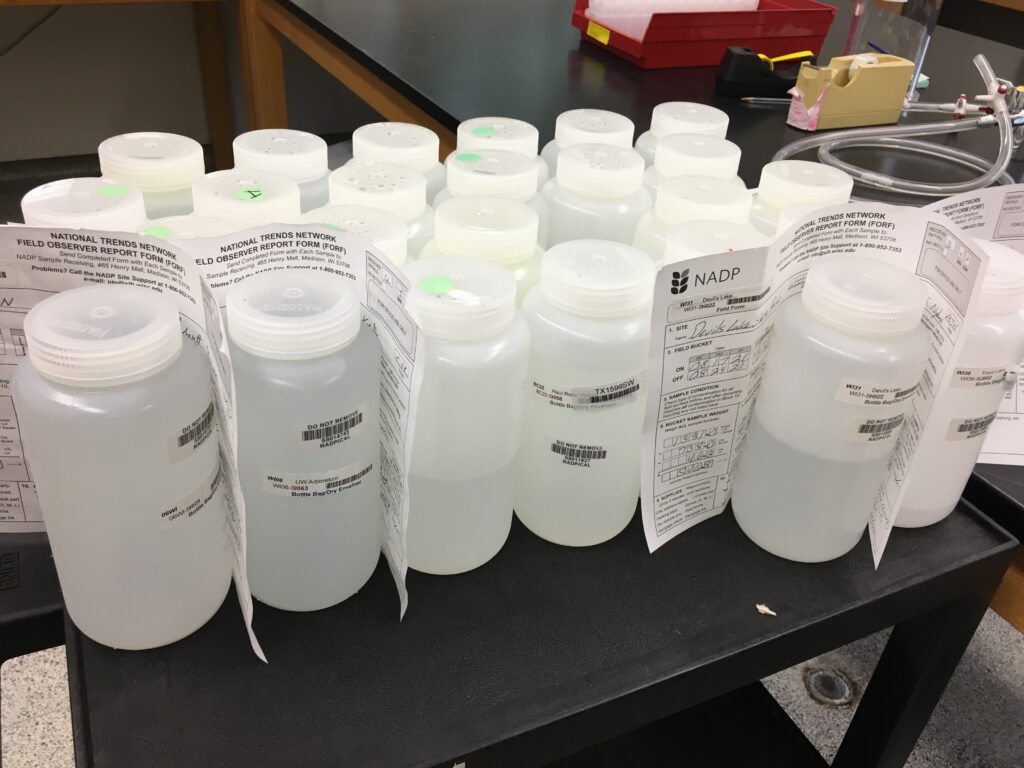
Next, the sample is transported into the laboratory for measurements of pH, conductivity and filtration. Meanwhile, bottles and lids used in the field are sanitized in dishwashers, and then returned to site personnel at the network sites.
2. Analysis
Chemical
The pH/conductivity analyst checks each sample in its 1-liter bottle for contamination and compares this information with initial data from the field operator. Water samples are poured into two 4-milliliter vials, and pH (a measurement of “acidity”) and conductivity (a measure of ionic strength) are completed. Within four days of receiving a sample, all samples are measured for pH and conductivity.
The remainder of the precipitation sample volume is filtered, removing solids from the sample in the 1-liter bottles into 60-milliliter bottles. These 60-ml subsamples are used for the remainder of the analysis. If there is a sufficient amount of liquid, a portion of the sample is refrigerated and included in a water sample archive at the NAL. These samples are kept for three years.
Major Ions
Within two weeks, the samples are analyzed for sulfate, nitrate, and chloride by ion chromatography; calcium, magnesium, sodium, and potassium by inductively coupled plasma-optical emission spectroscopy; and ammonium and orthophosphate by flow injection analysis.
These individual instruments are run independently by chemists in the laboratory.
3. Quality Assurance, Review, and Site Support
A preliminary report combining information from the sample entry form and chemistry results is generated. The preliminary report will be reviewed and is used to alert staff members to any potential errors.
The longest part of the process is the two stages of data review, during which NAL staff members look for data incompleteness and errors, such as equipment problems and collector inefficiencies, and then review data, searching for inconsistencies with past information.
The quality assurance process involves checking bottles, lids, and bags at random for cleanliness. If there is a problem, the equipment is rewashed and rechecked. While handling samples and equipment, NAL staff must ensure that they don’t contaminate any samples. Even the smallest drop of water added to a bottle or lid can alter the results.
Control samples are also analyzed to ensure the quality of sample collection analysis.
4. Data Dissemination
Finally, the data are disseminated through the NADP Web site at no charge to users. This site offers online retrieval of individual data points, seasonal and annual averages, trend plots, concentration and deposition maps, and reports.
Data can be retrieved at http://nadp.slh.wisc.edu/networks.
Presentations
Public Education Videos
Educational Videos
Ammonia Deposition and Agriculture

Nitrogen Deposition